Giriş
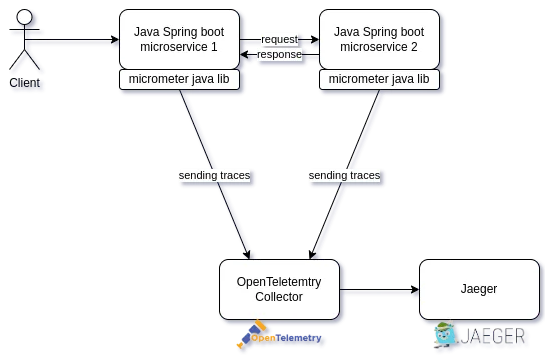
Open Telemetry + Jaeger
Şeklen şöyle
Gradle
Şöyle yaparız
dependencies {implementation "io.micrometer:micrometer-tracing-bridge-otel"implementation "io.opentelemetry:opentelemetry-exporter-otlp"}
Span Exporter için şöyle yaparız
@Bean
public OtlpGrpcSpanExporter otlpHttpSpanExporter(@Value("${tracing.url}") String url) {
  return OtlpGrpcSpanExporter.builder().setEndpoint(url).build();
}
application.properties şöyledir
management.tracing.sampling.probability=1.0
tracing.url=http://localhost:4317
OpenTelemetry vs Open Tracing
Açıklaması şöyle
The community in general is moving towards the OpenTelemetry observability framework. OpenTelemetry will most likely supersede OpenTracing at some point in the future.
OpenTelemetry Nedir?
Açıklaması şöyle
The OpenTelemetry website states that:"OpenTelemetry is a collection of tools, APIs, and SDKs. Use it to instrument, generate, collect, and export telemetry data (metrics, logs, and traces) to help you analyze your software's performance and behavior."OpenTelemetry was created by merging the popular OpenTracing and OpenCensus projects. It is a standard that integrates with many open source and commercial products written in many programming languages. Implementations of OpenTelemetry are in varying stages of maturity.At its core, OpenTelemetry contains the Collector, a vendor-agnostic way to receive, process, and export telemetry data.
Trace ve Span
Açıklaması şöyle
A trace tracks the progress of a single request as it passes through services. Distributed tracing is a form of tracing that traverses process, network, and security boundaries. Each unit of work is called a span. A trace is a tree of spans. Think of a distributed trace like a Java stack trace, capturing every component of a system that a request flows through, while also tracking the amount of time spent in and between each component.
Zipkin vs Jaeger
Açıklaması şöyle. Zipkin'ın Twitter, Jaeger'ı ise Uber geliştirmiş.
Zipkin and Jaeger are two popular choices for request tracing. Zipkin was originally inspired by Dapper and developed by Twitter. It's now maintained by a dedicated community.Jaeger was originally built and open sourced by Uber. Jaeger is a Cloud Native Computing Foundation project.
Açıklaması şöyle
Additionally, while Zipkin is an older project (initiated in 2012 at Twitter) written in Java, Jaeger is a newer project (commenced in 2017 at Uber) developed in Go.
Open Tracing + Jaeger
Burada arada bir OTL Collector yok
Maven
Şu satırı dahil ederiz
<dependency><groupId>io.opentracing.contrib</groupId><artifactId>opentracing-spring-jaeger-cloud-starter</artifactId><version>3.3.1</version></dependency>
Hem Zipkin hem de Jaeger kullanan projelerde kendimizin bir tane RestTemplate nesnesi yaratması gerekir. Şöyle yaparız
@Bean
public RestTemplate restTemplate(RestTemplateBuilder builder) {
  return builder.build();
}
Açıklaması şöyle. Jaeger'ın araya girip TraceID gönderebilmesini sağlar.
For the spans to get connected to the same trace id, We need to create a RestTemplate bean to allow Jaeger to include an interceptor. This then helps to add traces to the outgoing request which will help to trace the entire request.
Örnek - http
Jaeger sunucusunu belirtmek için şöyle yaparız
opentracing:
  jaeger:
    http-sender:
      url: http://localhost:14268/api/traces
Örnek - udp
Jaeger sunucusunu belirtmek için şöyle yaparız
opentracing:
  jaeger:
    udp-sender:
      host: 127.0.0.1
      port: 6831
    log-spans: true
Şöyle yaparız
@Bean
public JaegerTracer jaegerTracer(){
  return new io.jaegertracing.Configuration("usr-mgt")
    .withSampler(new io.jaegertracing.Configuration.SamplerConfiguration()
                   .withType(ConstSampler.TYPE)
                   .withParam(1))
    .withReporter(new io.jaegertracing.Configuration.ReporterConfiguration()
                   .withLogSpans(true))
    .getTracer();
}
Jaeger Sunucusu
Şeklen şöyle. Dağıtık yapıya sahip
Docker Compose
Açıklaması şöyle
The Jaeger All-In-One can be easily set up with all the necessary components to test your Java application and ensure that it correctly sends traces. It also includes an OpenTelemetry Collector module for collecting OpenTelemetry traces.
Örnek
Şöyle yaparız. Daha sonra http://localhost:16686/ adresine gideriz.
version: "3.3"
services:
  jaeger-allinone:
    image: jaegertracing/all-in-one:1.25
    ports:
      - 6831:6831/udp
      - 6832:6832/udp
      - 16686:16686
      - 14268:14268
docker ile çalıştırmak istersek şöyle yaparız
docker run -d --name jaeger \
  -e COLLECTOR_ZIPKIN_HOST_PORT=:9411 \
  -p 5775:5775/udp \
  -p 6831:6831/udp \
  -p 6832:6832/udp \
  -p 5778:5778 \
  -p 16686:16686 \
  -p 14268:14268 \
  -p 14250:14250 \
  -p 9411:9411 \
  jaegertracing/all-in-one:1.24
Örnek - OLTP Collector
Şöyle yaparız.
version: '3.7'
services:
  jaeger:
    image: jaegertracing/all-in-one:latest
    ports:
      - "16686:16686" # the jaeger UI
      - "4317:4317" # the OpenTelemetry collector grpc
    environment:
      - COLLECTOR_OTLP_ENABLED=true
Jaeger GUI
http://localhost:16686/ adresine gitmek gerekir. Bir işlemin hangi çağrılarda ne kadar süre tuttuğu gösteriliyor. Şeklen şöyle


Hiç yorum yok:
Yorum Gönder